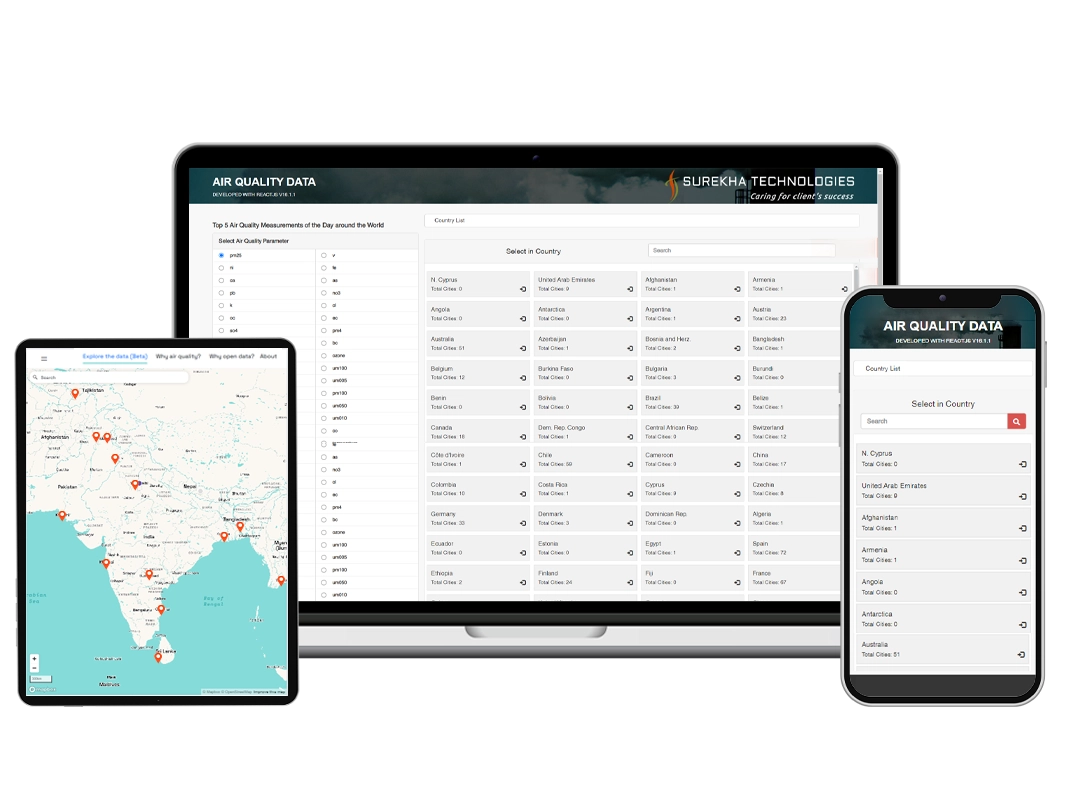
Air Quality Indicator Dashboard using React JS Frameworks
About Customer
Our client is an environmental consultancy and service provider that helps businesses and communities in achieving cleaner air through effective emissions reduction strategies.
Since its establishment in 2007, they have expanded their team to include 125 environmental experts. With a focus on enhancing public health and enabling real-time data visualization, our client seeks an intuitive dashboard capable of retrieving and displaying AQI data.
Number of Employees : 125+
Business Needs & Challenges
-
AQI Data collection: Gathering Air Quality Index (AQI) data from different sources and formats across different countries without an API integration was a real challenge for the client.
-
Real-time data visualization: Our client struggled to monitor AQI levels from multiple cities and countries around the world in real-time on a single platform.
-
Data-driven insights: The client was unable to analyze AQI data, identify pollution sources, predict future trends, and make informed decisions due to unavailability of data in a single source.
Services Provided
OUR APPROACH
Our approach was to integrate reliable air quality index data and showcase it collectively on an intuitive dashboard through JS frameworks.
CONSULTING
Understanding the challenges faced in collecting and showcasing AQI data from various sources, we proposed a solution and anticipated results utilizing our expertise in React JS development services.
DESIGN
We prioritized intuitive navigation and mobile responsiveness in designing the UI/UX of the Air Quality Indicator Dashboard. The aim was to enhance user experience by integrating real-time AQI data.
DEVELOPMENT
Using our expertise in JS frameworks, we developed a dashboard integrating API for data sources. Our agile development process ensured feedback and iteration to accommodate changing needs.
DEPLOYMENT
Following QA testing, we deployed the AQI dashboard to the client’s infrastructure through phased rollouts. We offered continuous post-deployment support to ensure user adoption and adaptability.
key features
-
Real-time Data Visualization
-
Intuitive Reports
-
Interactive Maps
-
API Integration
-
Mobile Responsiveness
-
User-friendly Interface
-
Data-driven Insights
-
Live notifications
Technology Stack & Tools

Liferay

ReactJS
OUR APPROACH
Our approach was to integrate reliable air quality index data and showcase it collectively on an intuitive dashboard through JS frameworks.
CONSULTING
Understanding the challenges faced in collecting and showcasing AQI data from various sources, we proposed a solution and anticipated results utilizing our expertise in React JS development services.
DESIGN
We prioritized intuitive navigation and mobile responsiveness in designing the UI/UX of the Air Quality Indicator Dashboard. The aim was to enhance user experience by integrating real-time AQI data.
DEVELOPMENT
Using our expertise in JS frameworks, we developed a dashboard integrating API for data sources. Our agile development process ensured feedback and iteration to accommodate changing needs.
DEPLOYMENT
Following QA testing, we deployed the AQI dashboard to the client’s infrastructure through phased rollouts. We offered continuous post-deployment support to ensure user adoption and adaptability.

