A better analysis of work helps to grow a business and improve it widely. Every organization analyzes the performance of services and decides to implement accurate actions as per business standards. It will assist in fulfilling new openings in a firm and boosting the progress of business with a comprehensive analysis. Attendees and Reviews are prominent when concerning the eLearning Module of Odoo. Appropriate learning materials are quickly found through better analysis of eLearning activities. You can handle the reports of a particular operation with the Odoo 15 eLearning module.
This blog defines the Reporting features of Attendees, Reviews, and Courses that Odoo provide for various courses depicted in the eLearning platform.
Odoo enables you a Reporting tab to manage all the reports for courses and contents in the eLearning module. We can access several reports with different measures inside the Reporting tab. Apart from these, you can analyze the Certifications, Quizzes, Attendees, Contents, Forum, Courses, Reviews, and Contents.
Reporting
The Reporting tab is visible in the eLearning dashboard of Odoo 15. Users can create several Reports based on operations of eLearning from here, and it supports the business management. We can see various menus such as Courses, Revenues, Reviews, Forum, Contents, Attendees, Quizzes, and Certifications inside the Reporting tab.
Attendees
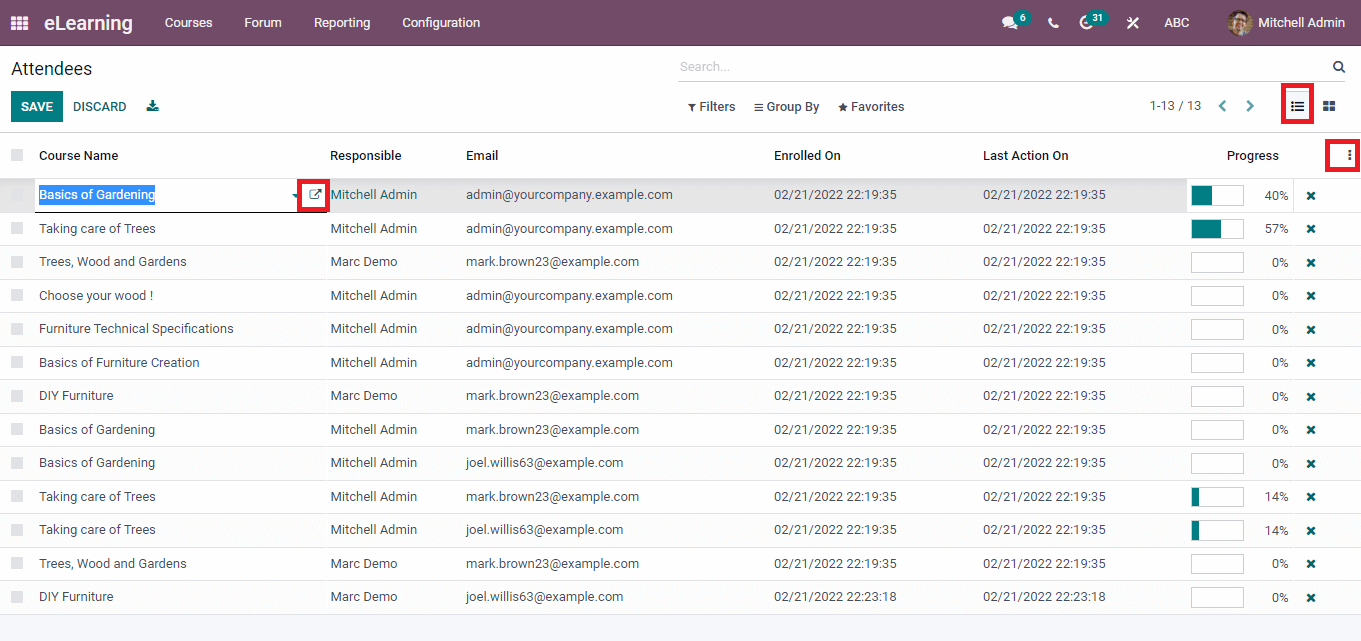
We can get Attendees outlines in each course in the eLearning platform using the Attendees Report. To access it, click on the Attendees menu from the Reporting tab, and the Attendees Report window is visible for the user. In the List view of Attendees window, you can see the information such as Responsible person, Enrolled date, Progress, Course Name, Email, and Last Action On. You can also add Custom Fields like Website, Visibility, Course Type, and Enroll Policy by clicking on the three-dot button at the right end. The external link near Course Name directs you to a particular course page.
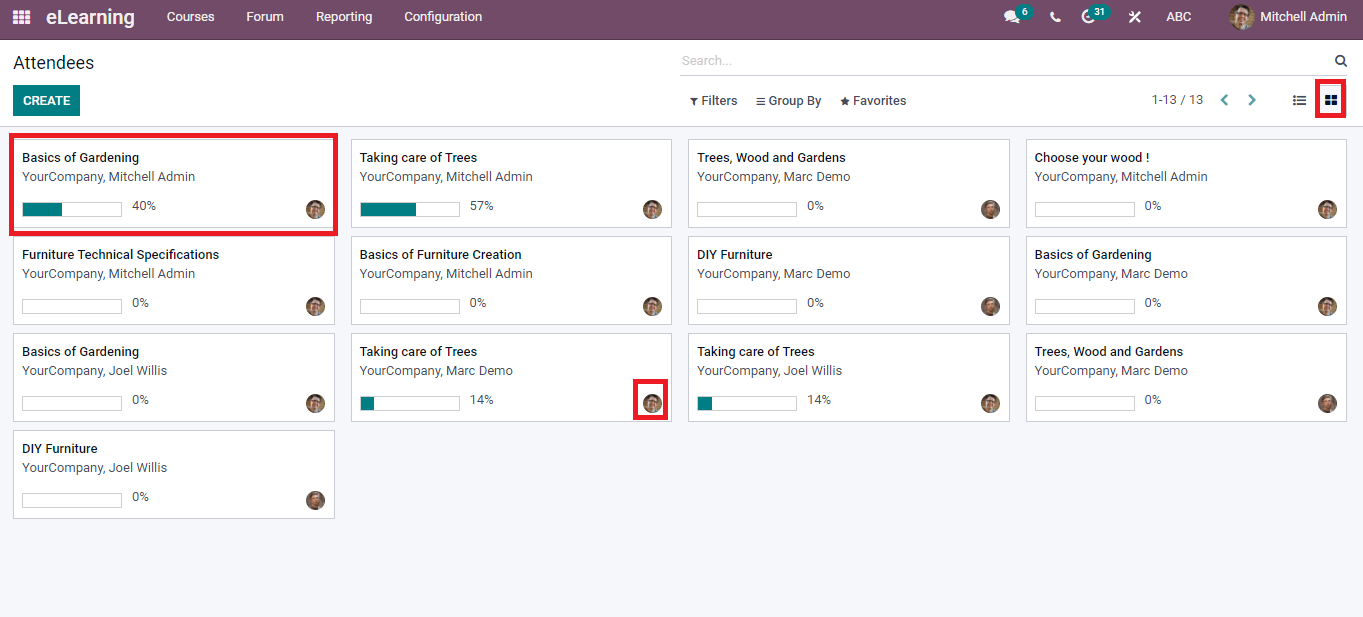
In the Kanban view, you can view the Course title, Company, Responsible person and Progress rate inside a box. We can message the Responsible person of a particular course by clicking on the image near the progress rate.
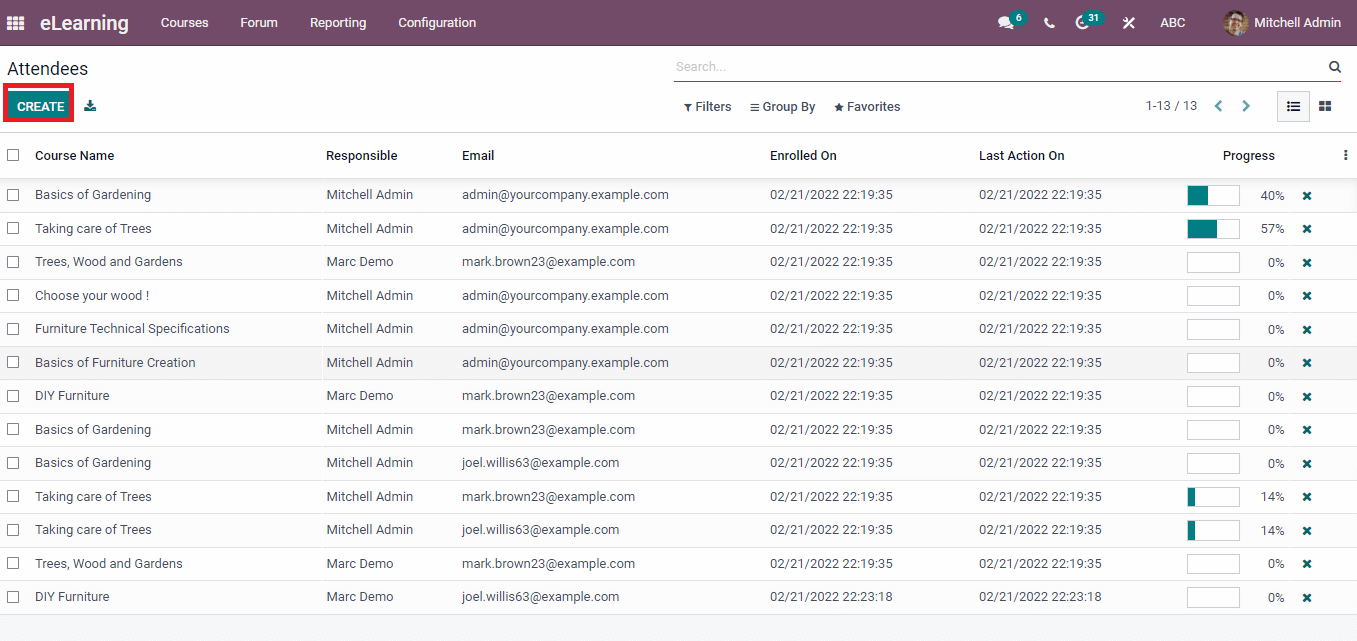
The Create button in the Attendees window assists you in developing a new Attendee for a specific course visible in the screenshot below.
Revenues
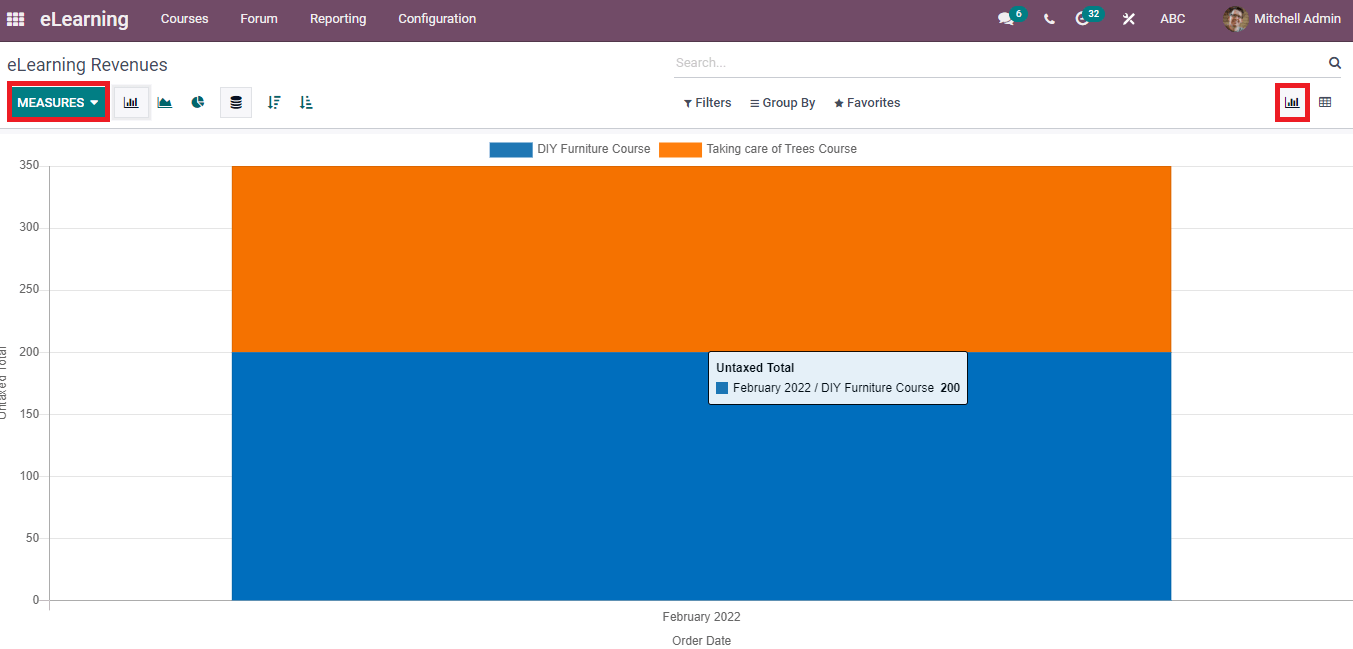
The sale of courses through the eCommerce platform will bring revenues for a company. Statistical reports of sales in each course are visible in the eLearning Revenue reports. Select the Revenues menu from the Reporting tab. In the Graph view, we can see the Order date on the X-axis and the Untaxed Total on Y-axis. You can add several measures such as Discount Amount, Margin, Qty to Deliver, Total, Untaxed Amount To Invoice, and more options by clicking on the Measure icon. Pie, Line, and Bar charts are viewable in the Graphical view of eLearning Revenues.
Quizzes
A quiz consists of several formats, and it is to test an individual’s knowledge level. In a short form, it contains fill-in blanks, multiple choices, and true or false. Click on the Quizzes menu in the Reporting tab, and you can see the list of questions for specific Content. The details include Question Name, Attempts Count, Done Count, Content and Attempts Avg depicted in the screenshot below.
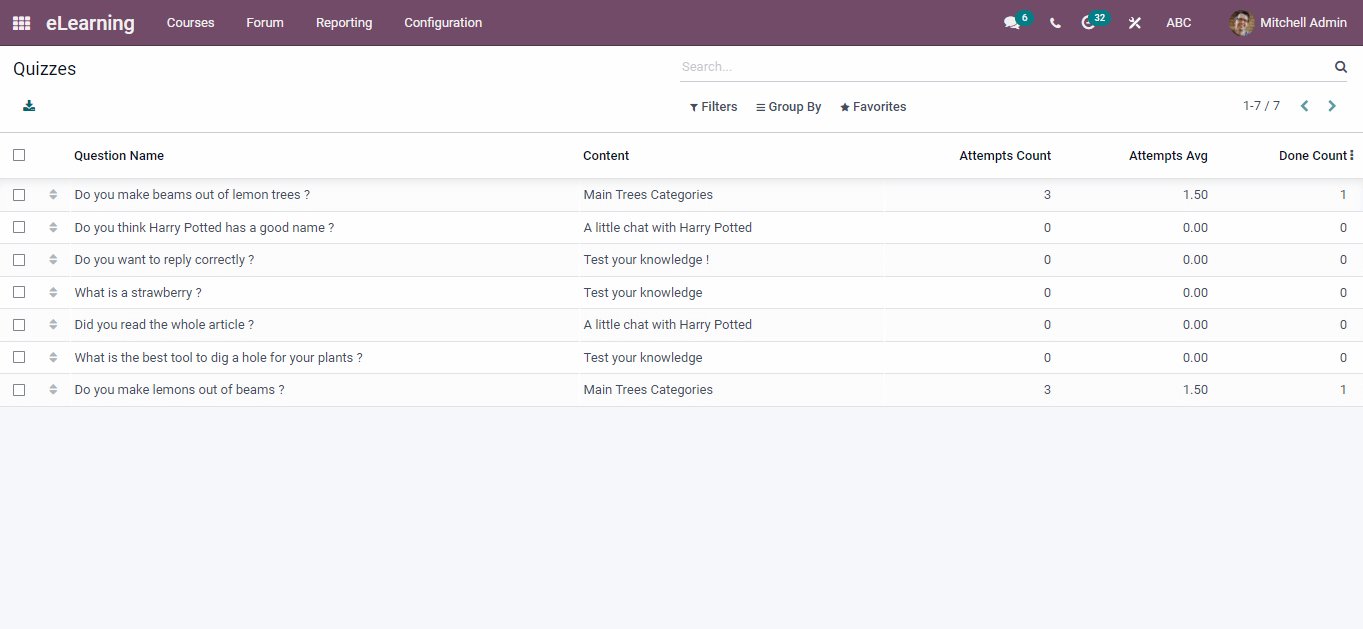
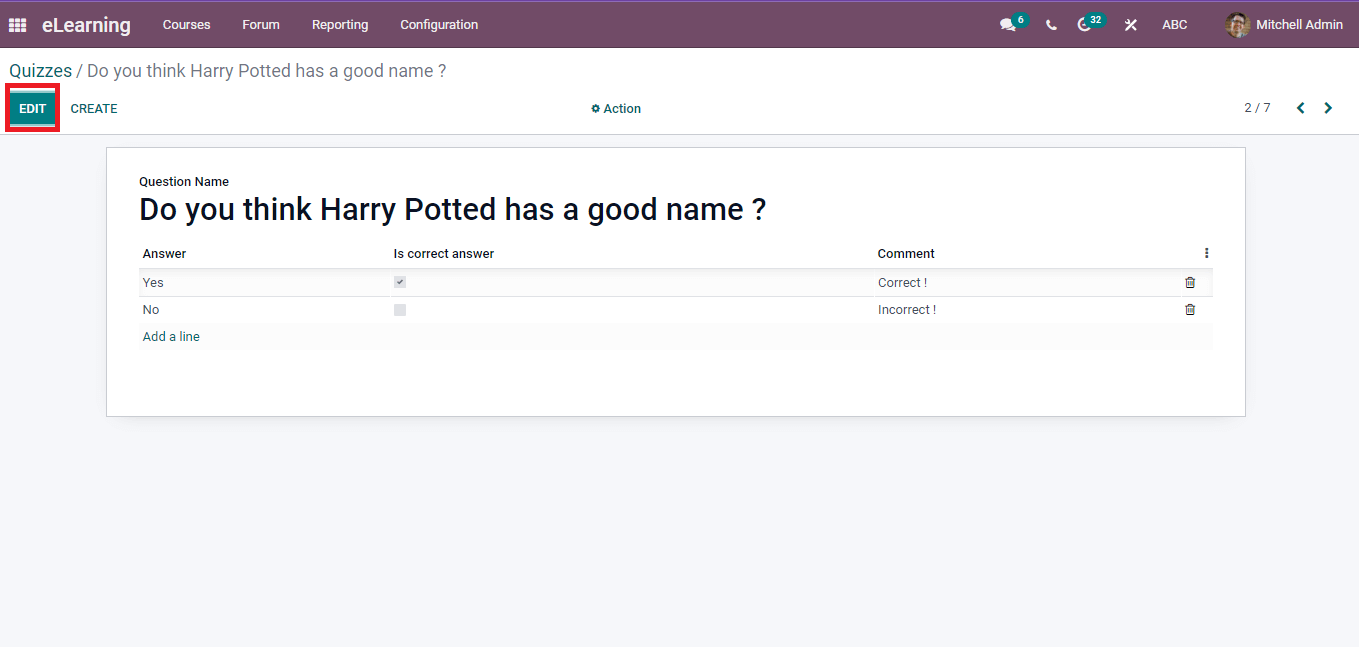
By clicking on a specific Question Name, you can see the Answers, Comments and Correct answers for the question. The Edit icon assist you in making changes to the question.
Courses
The reports regarding the courses in the eLearning module are visible in the Courses window. Select the Courses menu in the Reporting Tab, and we can see the list of Courses reports. The Courses window is viewable in Kanban and List formats. The list view of the page includes information about Course Name, Duration, Votes, Rating Average, number of Visits, and Votes shown in the screenshot below.
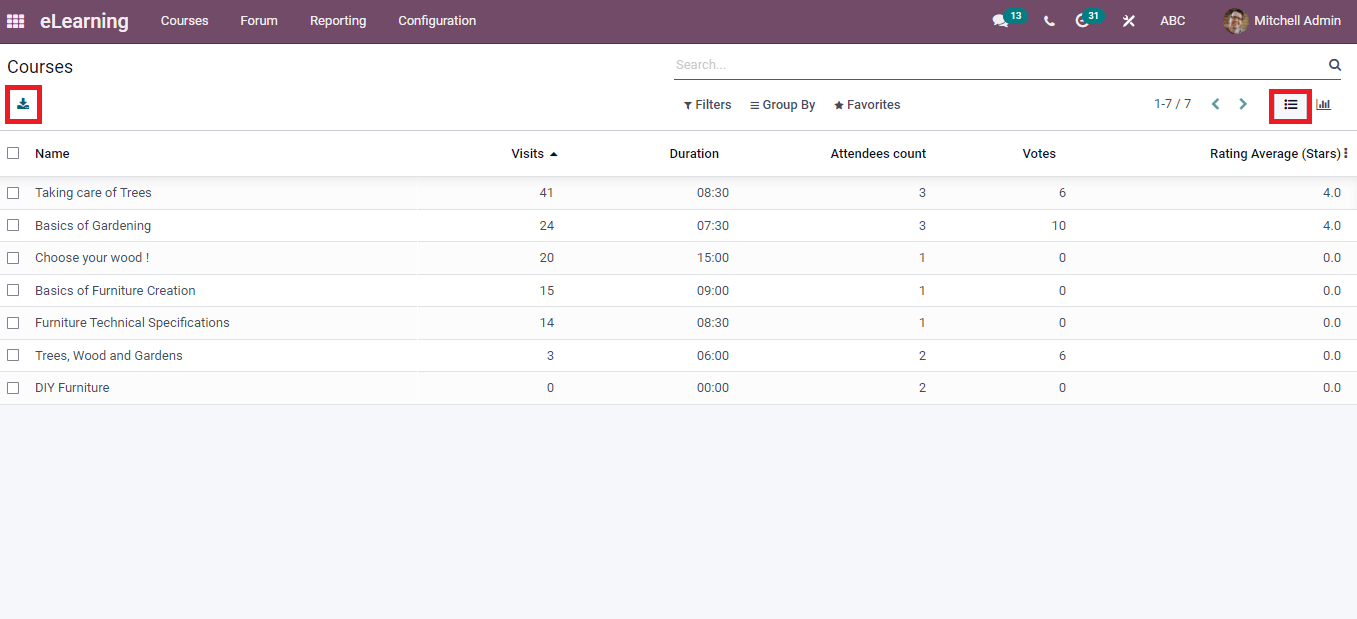
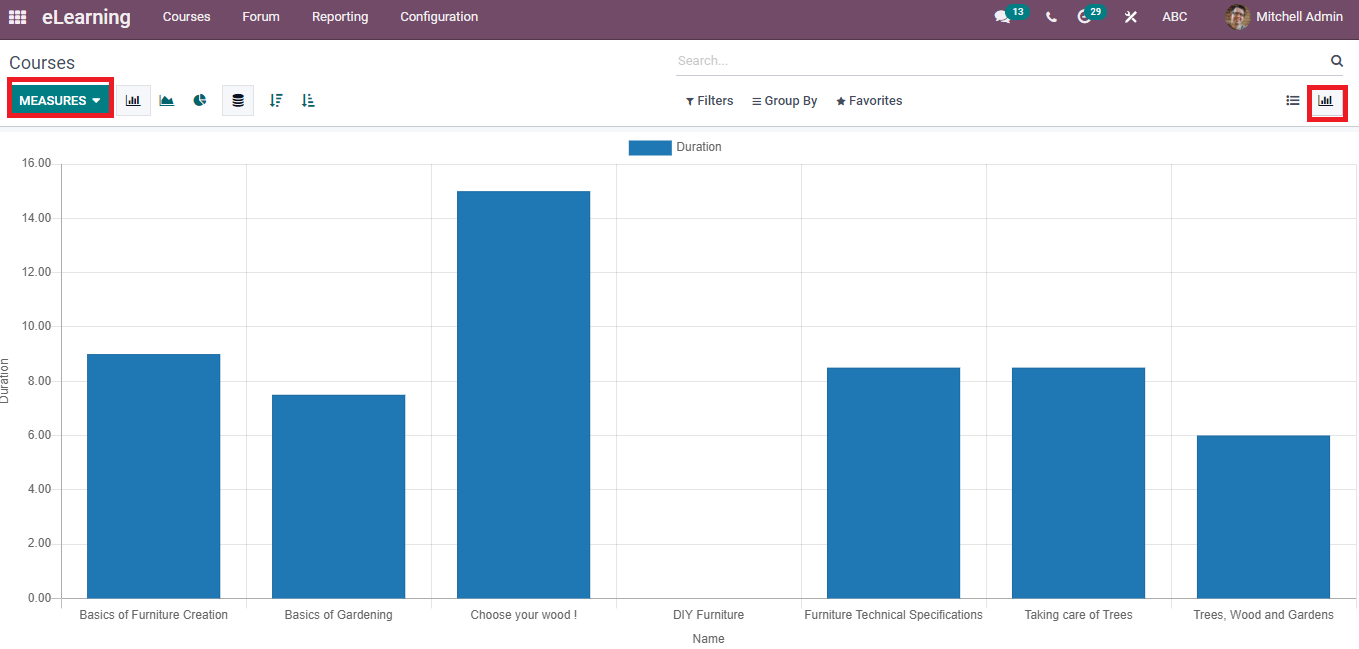
The Export icon on the left side of the window helps export data into an excel format file. We can see the Courses reports in a graphical representation by pressing on the Graph view of the window. Course Name is depicted on X-axis, and Y-axis shows the Count of Visits. Moreover, the Courses window is accessible in several measures like Add Review, Content; Course Ranked, Duration, Lesson Voted, Number of Quizzes, Sequence, Webpage and more aspects. You can apply all these measures by clicking on the Measures icon on the Courses page represented in the screenshot below.
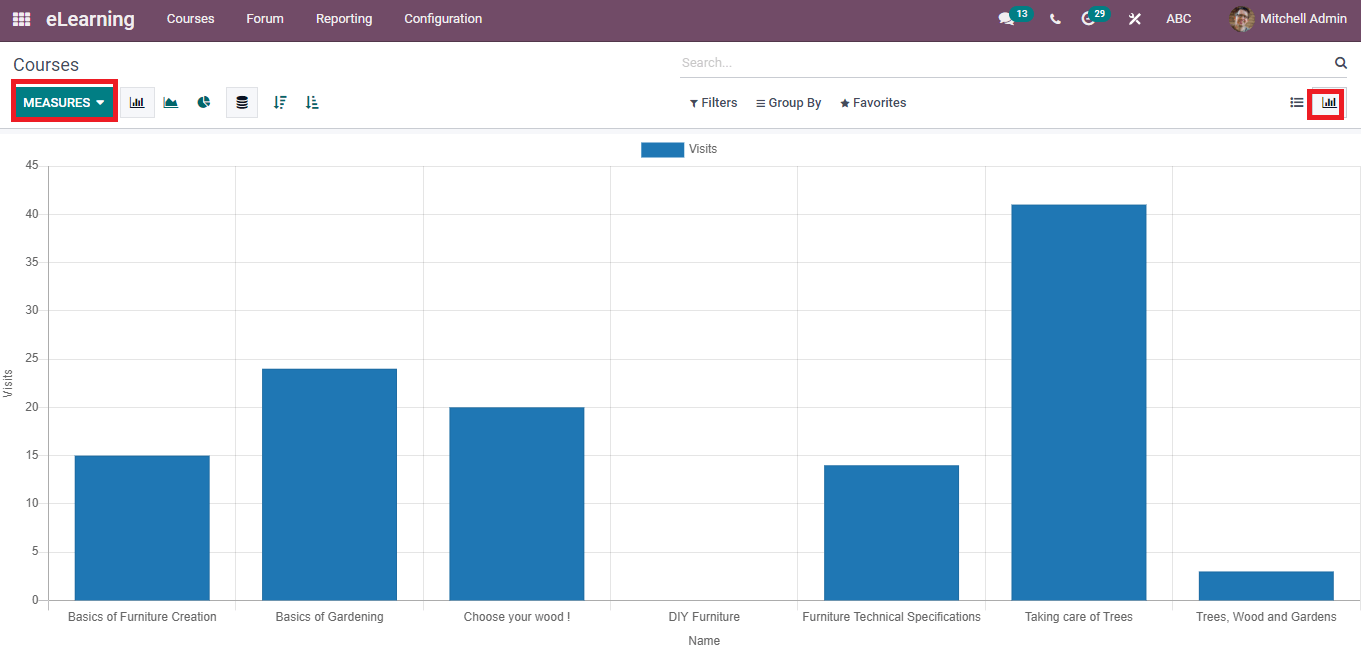
For example, if you want to see the window based on the Duration of each course, you can choose the Duration option inside the Measures icon. Hence, the graph’s Y-axis mentions the Duration for each course and the image of the window shown below.
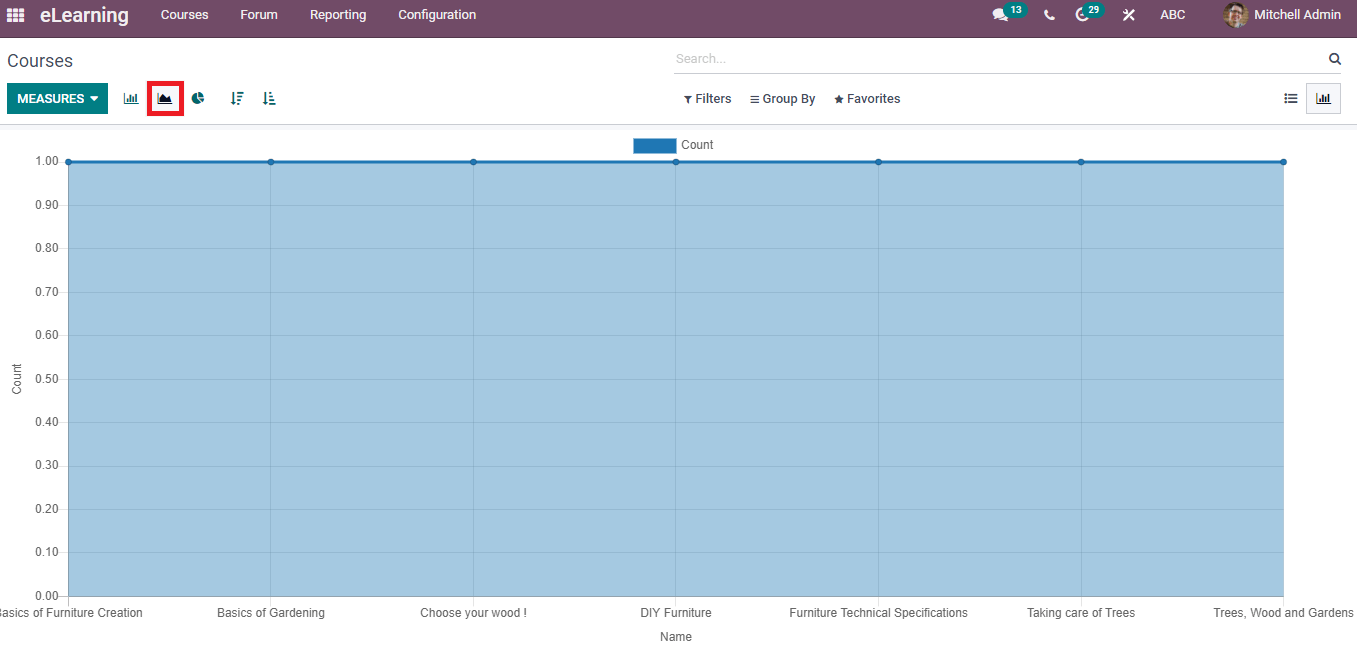
The Line Chart representation of reports is shown in the screenshot below.
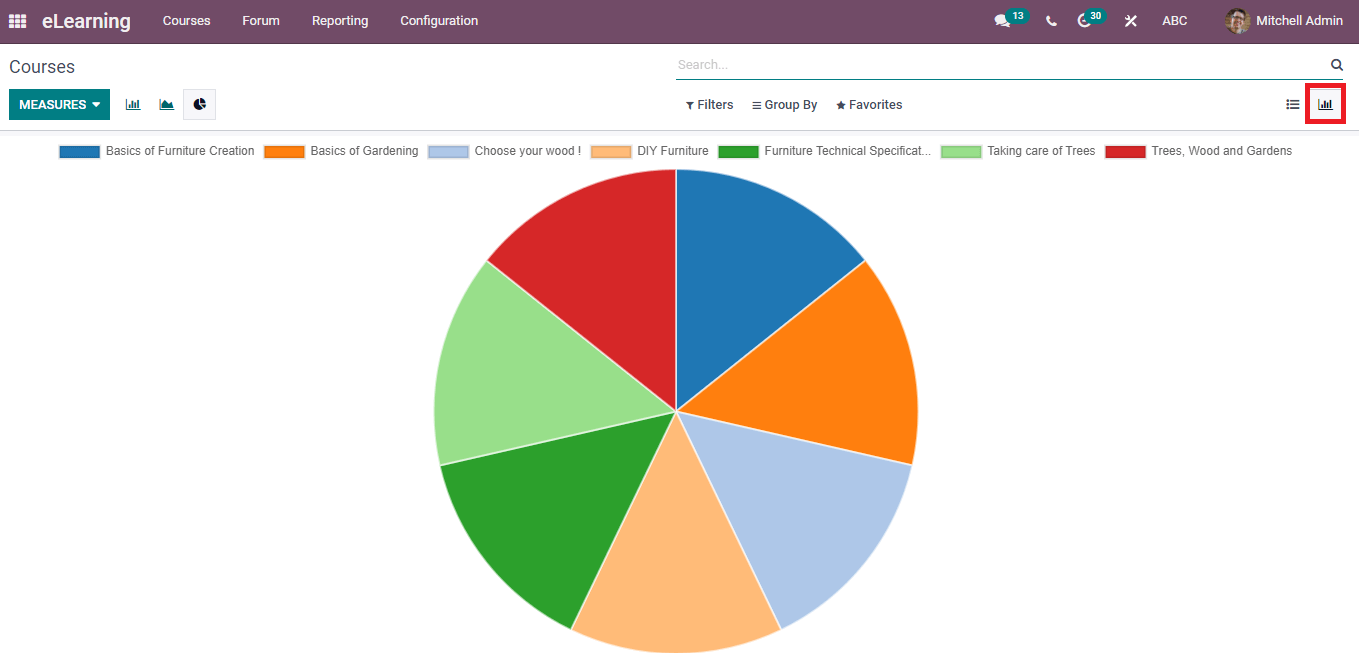
Next, we can view the Pie Chart form of the Courses window in the eLearning dashboard. The pie chart is viewable in a circle format, and several colours rely on each data. Each slice consists of unique colours depicted in the screenshot below.
Contents
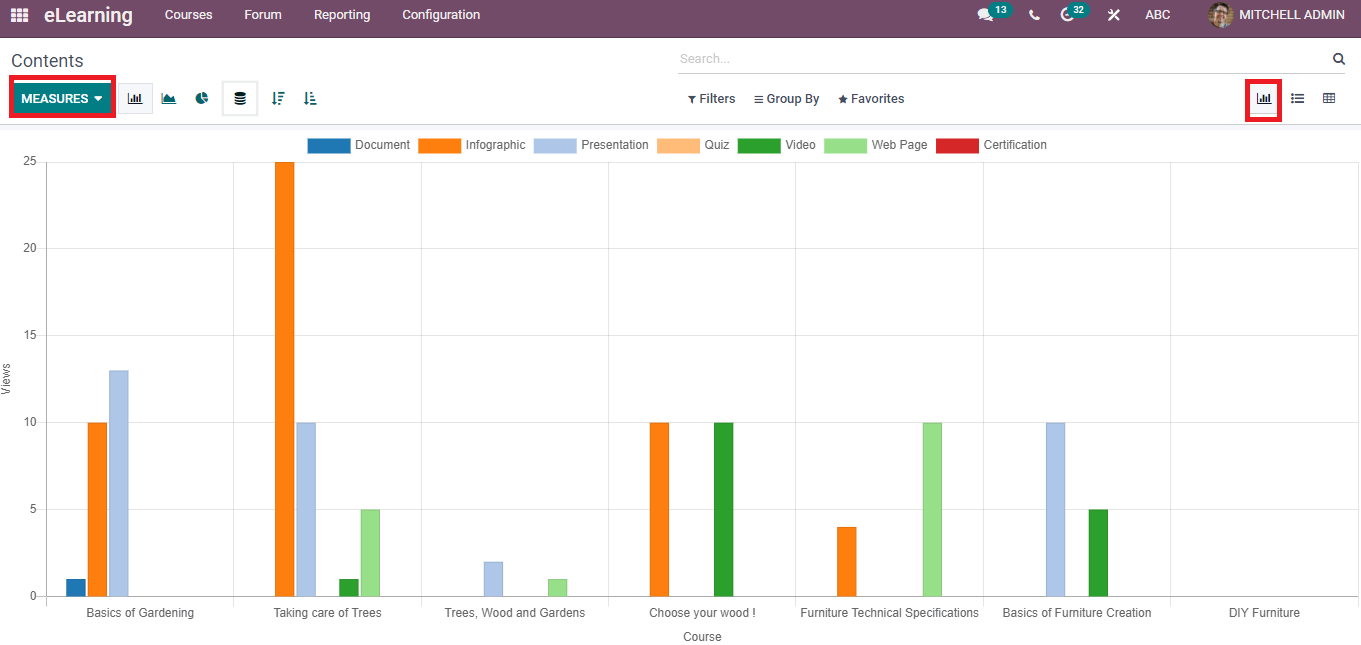
Click on the Contents menu in the Reporting tab of the eLearning module, and you will direct into the Contents report window. The course reports are displayed based on the Views in the graphical representation. Various colour formats are available for infographics, Quizzes, Webpage, Documents, Certifications, videos, and Presentations. Here, you can develop several measures using the Measure button. The Stacked icon makes the reports visible in a stacked format for users.
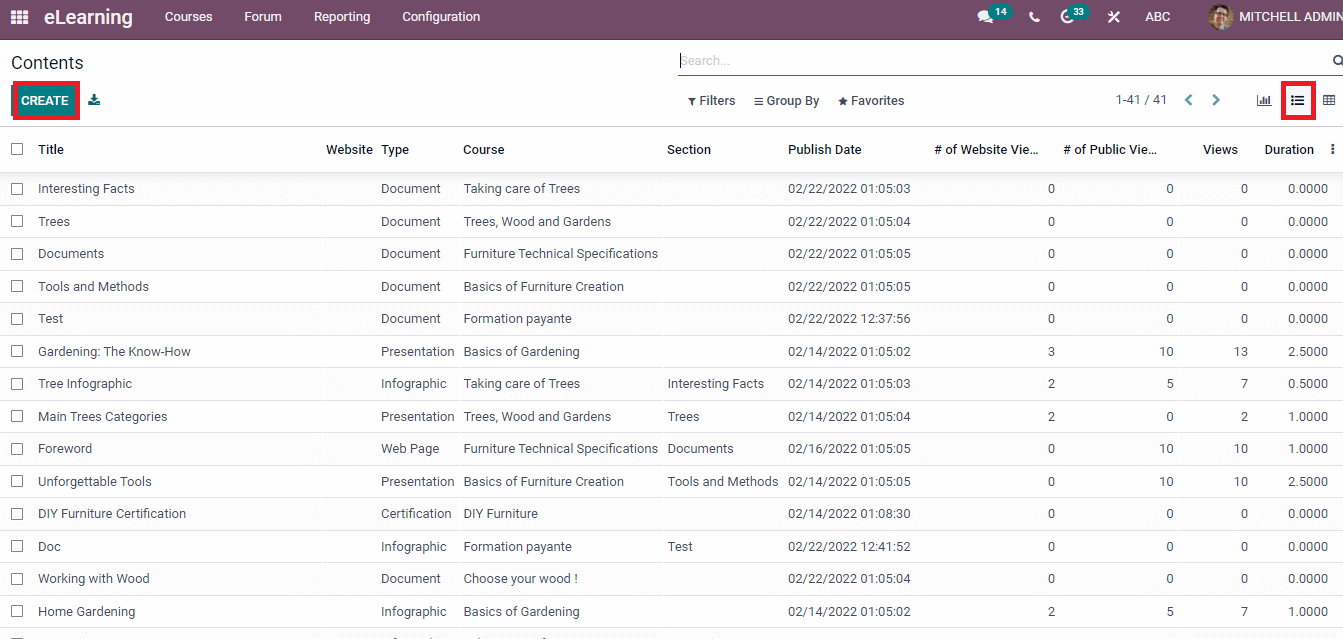
In the List view, you can see the List of Contents in Courses of the eLearning platform. The window shows the details of Contents under different headings such as Title, Section, Type, Website Views, Course, Duration, Public Views and Section. Users can generate new Content by selecting the Create icon in the Contents window, and the screenshot displays below.
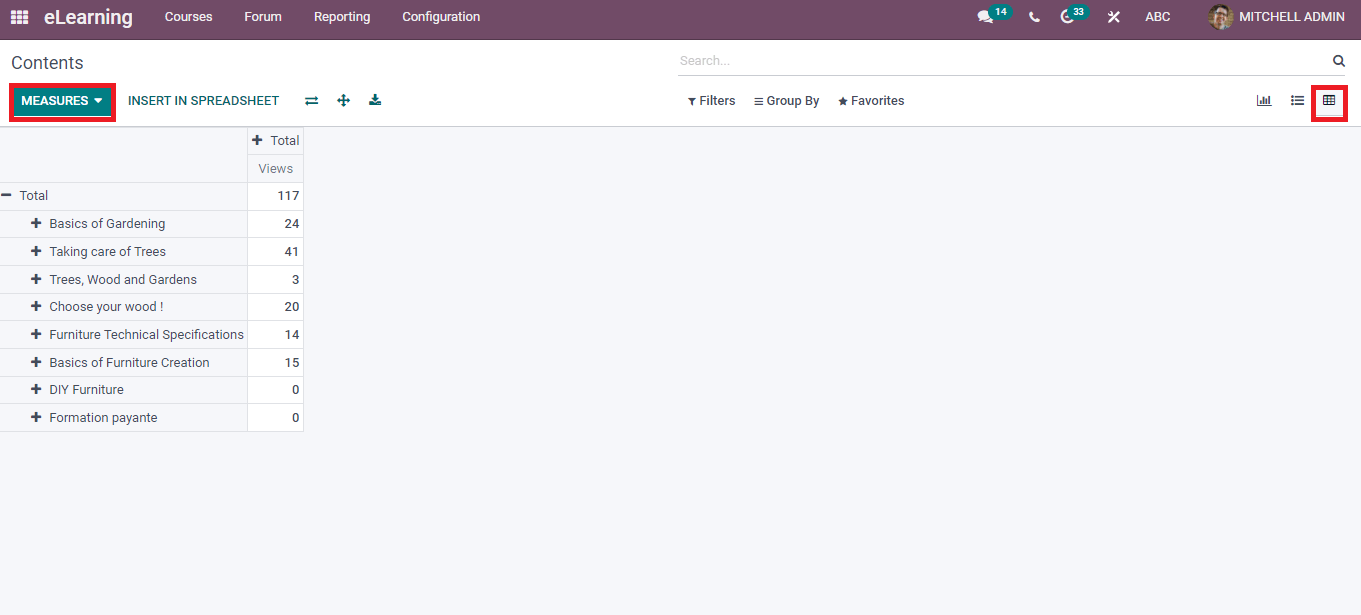
The tabular format of data is visible in the Pivot view, and it shows total Views per Content. You can create several reports using the Measure button. It is possible to view the Pivot table in several formats, such as Expand all and Flip axis.
We discuss the Reporting features of the Odoo eLearning module such as Attendees, Revenues, Courses, Quizzes, and Contents here. You get the advanced reports regarding the above parts using the Reporting tab in the eLearning dashboard. The measures and graphs are displayed to users for each kind of report. Hence, it is easy to analyze and figure out the fallbacks regarding each section through the Odoo Reporting tab.


