What is MPS in Odoo ERP?
The master production schedule is a production forecasting mechanism focused on the forecasted demand. This functionality is only included in the enterprise edition. Typically manufacturers manufacture goods in bulk volumes. So to plan the production in an effective way, MPS can be used. This tool will calculate the demand based on forecasted demand. Also if the estimation is wrong, that is if the estimation goes below or above the actual need, that can also be adjusted.
How to enable MPS in Odoo 14?
MPS should be enabled from the manufacturing module’s configuration settings. Go to Manufacturing> Configuration> Settings> Planning> Enable Master Production Schedule.
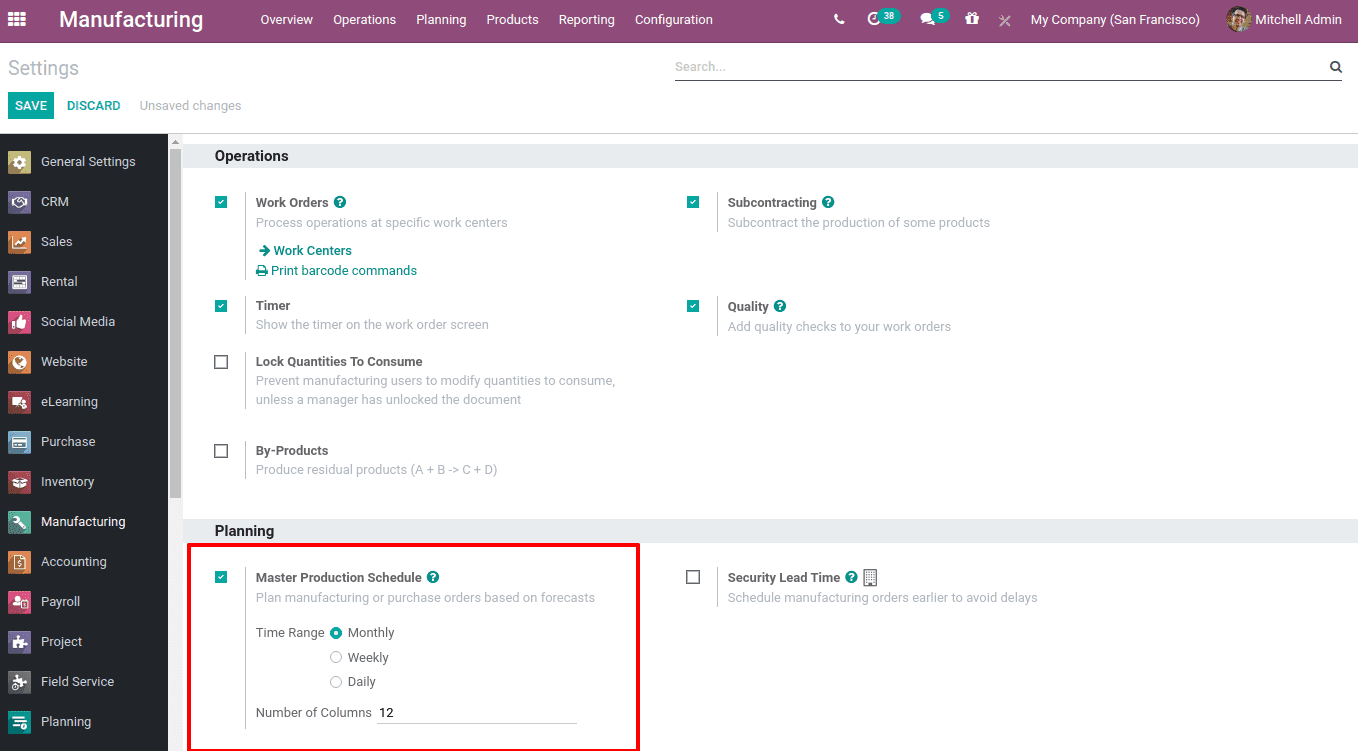
When you enable MPS, the time range can also be defined. The time range can be Monthly, Weekly, Daily, and the Number of periods needed to be displayed can also be defined at the specified field. Then Save changes.
Uses of Odoo 14 MPS
Now under menu ‘Planning’ you can find the option Master Production Schedule.
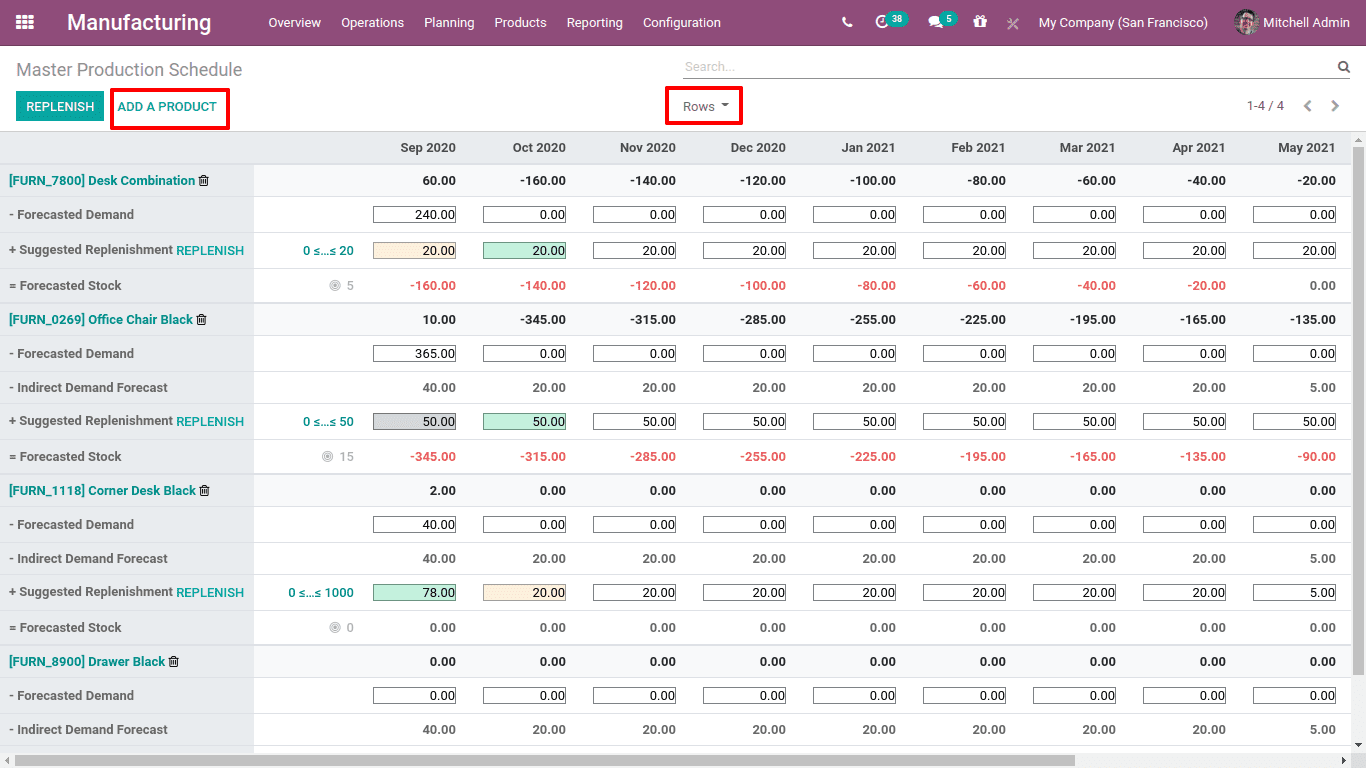
You can see there are 12 columns as mentioned in settings defining the next 12 periods (months).
The details or rows displayed on the screen can be restricted using the dropdown menu ‘Rows’.

Those enabled options will be displayed in the screen with their corresponding values.
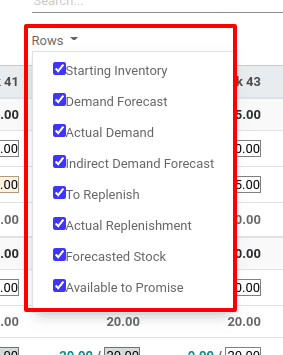
Starting inventory: Quantity on hand while starting
Demand Forecast: Estimated demand
Actual Demand: Confirmed demand
Indirect Demand Forecast: Estimated demand of indirect product / components
To Replenish: Quantity to replenish based on MO / PO
Actual Replenishment: Quantity being replenished based on MO / PO
Forecasted stock: Estimated quantity in stock till the end of period
Available To Promise: Quantity promised to be available for sale
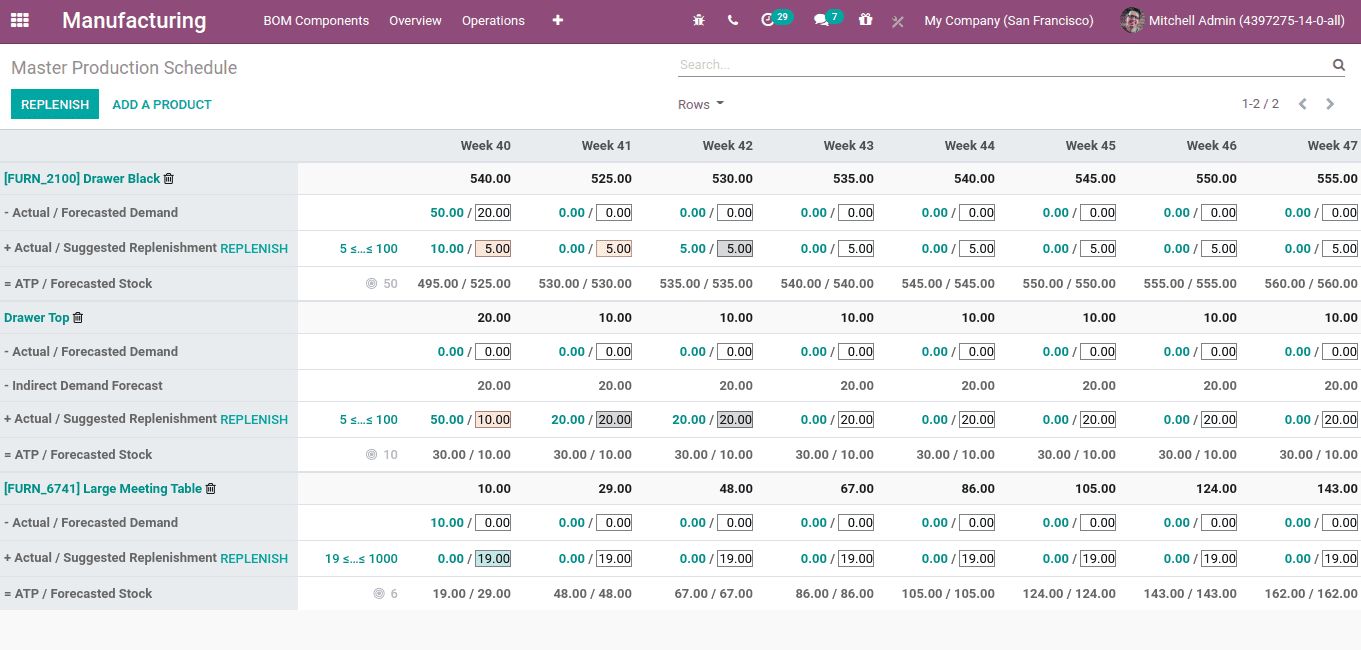
So when all rows are enabled, the details displayed as below.
Another thing to be noted is that the route must be set for the product that you are adding to MPS. The route should be ‘manufacturing’ then only it can generate the MO on replenishment.
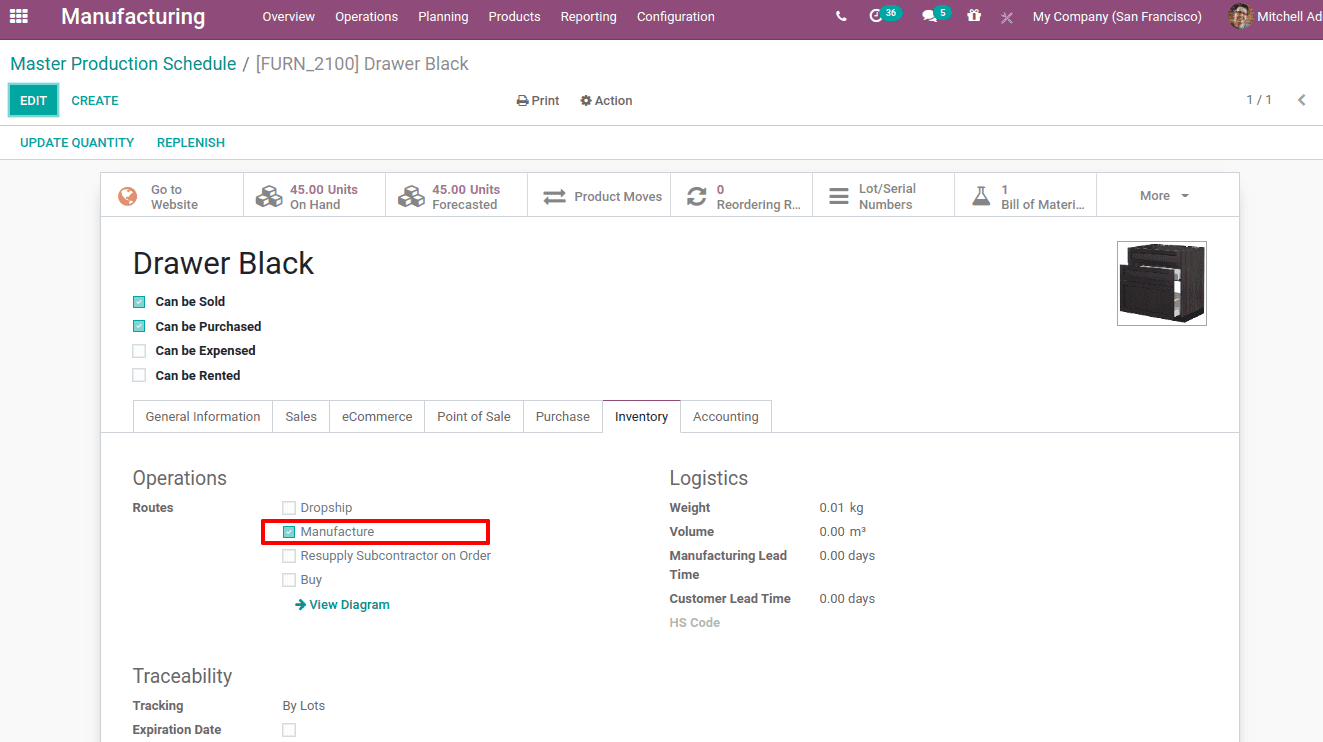
Now let us add the product to MPS. One can add products to MPS using the ‘ADD A PRODUCT’ option.
When you click on ‘add a product’ another window will pop up to set a replenishment rule. Choose the product, safety stock target, minimum & maximum replenishment quantity.

Safety stock target: is the amount of stock that should be in hand till the end of the period as a safety stock.
Minimum to replenish: Minimum amount of stock to replenish
Maximum to Replenish: Maximum amount of stock to replenish
Now save the changes.
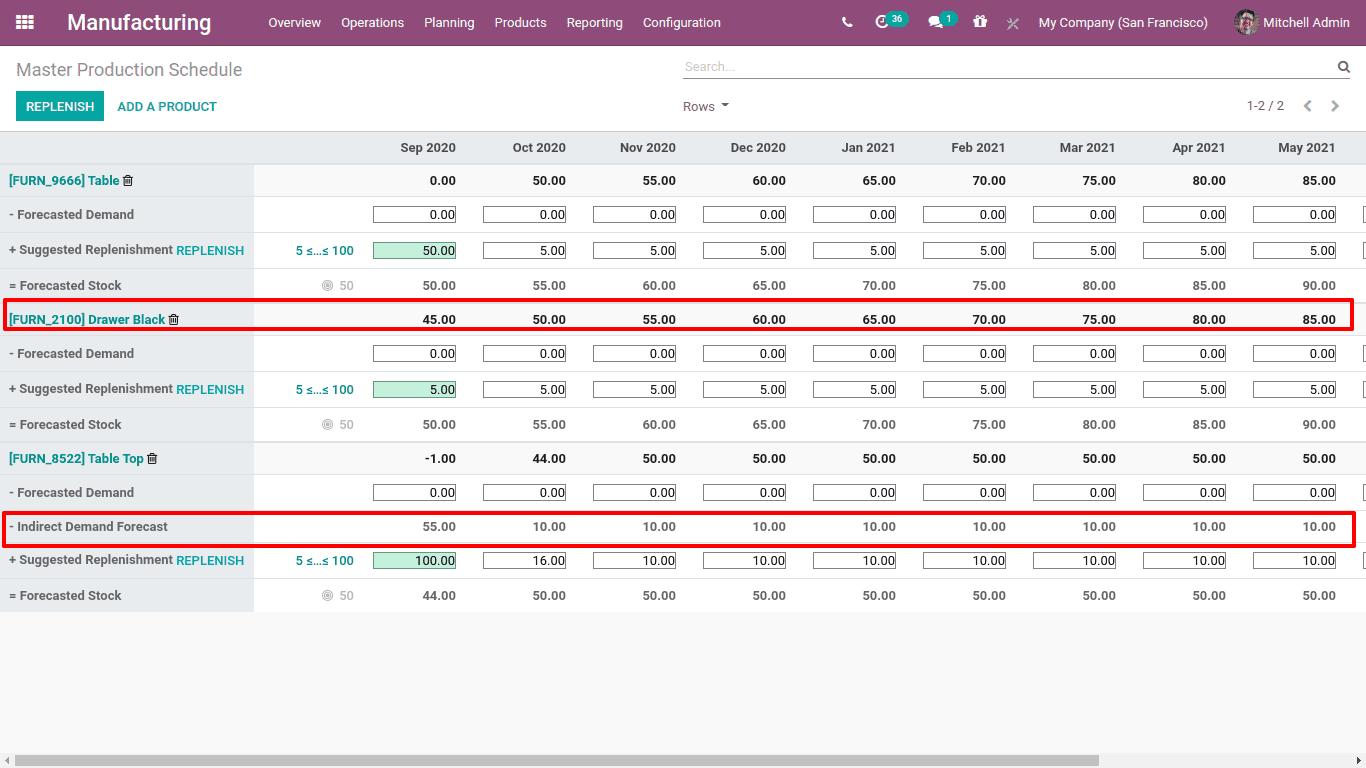
The first row gives the starting inventory. Right now, the on-hand quantity for this product ‘Drawer Black’ is 45. Thus the starting inventory entry (at the beginning of September) is 45.
There are 12 columns since the period given is 12 and each of the columns shows the stock details for the next 12 months from the start period.
Starting inventory is the starting stock volume (on hand) for this month.
Forecasted Demand is the estimated demand of stock for the current month. This value has to be entered manually.
Indirect Demand Forecast is the forecasted indirect demand for a product. It depends on the BoM, which means the demand for manufacturing a product may affect the demand of some other products. For example, the product ‘Table’ manufactured with table legs and table tops. To manufacture ‘Table top’ needs some wooden panels. So, as demand for table rises, demand for tabletops also rises. This is the indirect demand.
Suggested Replenishment is the amount to be replenished through a purchase order or manufacturing order.
Whenever replenish is triggered/clicked, it will send a PO or MO, based on the route given for the product.
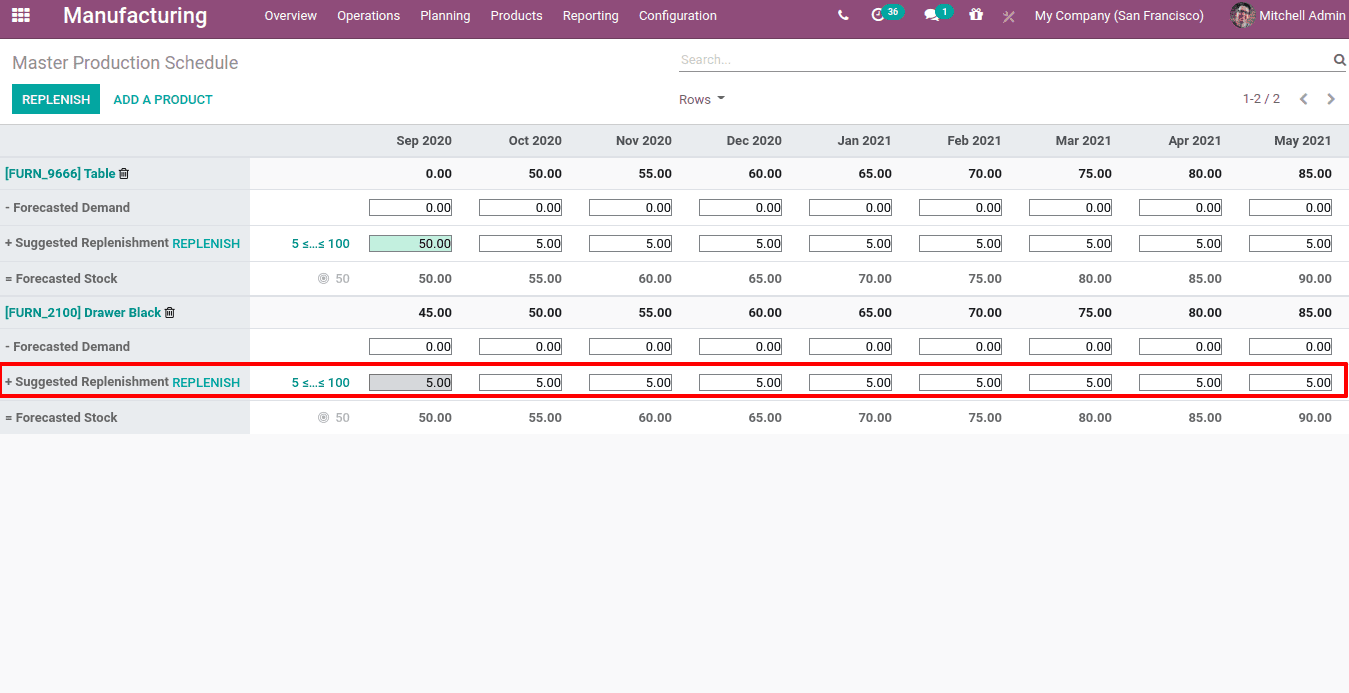
Thus the minimum replenish amount will be auto-filled in replenishment columns.
Now check the manufacturing orders created. For drawer black components given are a wood panel and a drawer top. So when Replenish is triggered, MO created for the product drawer as well as for indirect demand product drawer top.

Here the source of MO can be seen as MPS, since MO created from the Master Production Schedule.
Next is, Forecasted Stock is the measure of product quantity that we target to have in the stock till the end of the month. This forecasted stock will be the opening stock for the next period or month.
Forecasted stock = Starting Inventory – Forecasted Demand – Indirect Demand Forecast + Suggested Replenishment.
In this case we set safety stock as 50, minimum to replenish as 5 and maximum to replenish is 100. This rule can also be changed from the MPS by clicking on the gray circular point displayed nearer to the forecast stock.
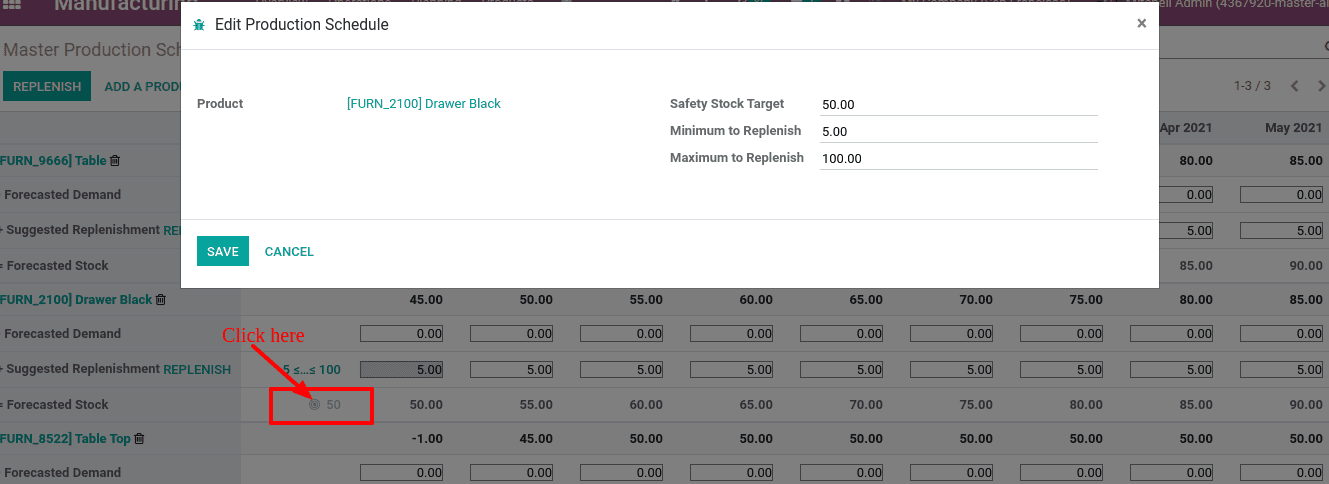
Now let us see how the calculation is working.

The starting inventory or the opening stock for the first month is 45. The minimum replenishment is set to 5. Thus the forecasted stock for September is 50. The starting inventory for the next period or month October is the forecasted stock of the previous month, ie 50 itself. And the forecasted stock is 55, so we have to produce 5 units for october.
Now let us add the forecasted demand. We know forecasted demand is the estimated quantity for the current month. Suppose we have demand for 20 products already. So at forecasted demand we manually entered 20 for the first month.

Once the forecasted demand enters the value for replenishment already changes. Here we have to replenish 25 products to make the forecasted stock as 50 since 20 is in demand and may be sold out. As per equation the calculation is,
Forecasted stock = Starting Inventory – Forecasted Demand – Indirect Demand Forecast + Suggested Replenishment.
Forecasted stock = 45-20-0 + 25
= 25 + 25
= 50
Now let us look on how indirect demand affects.
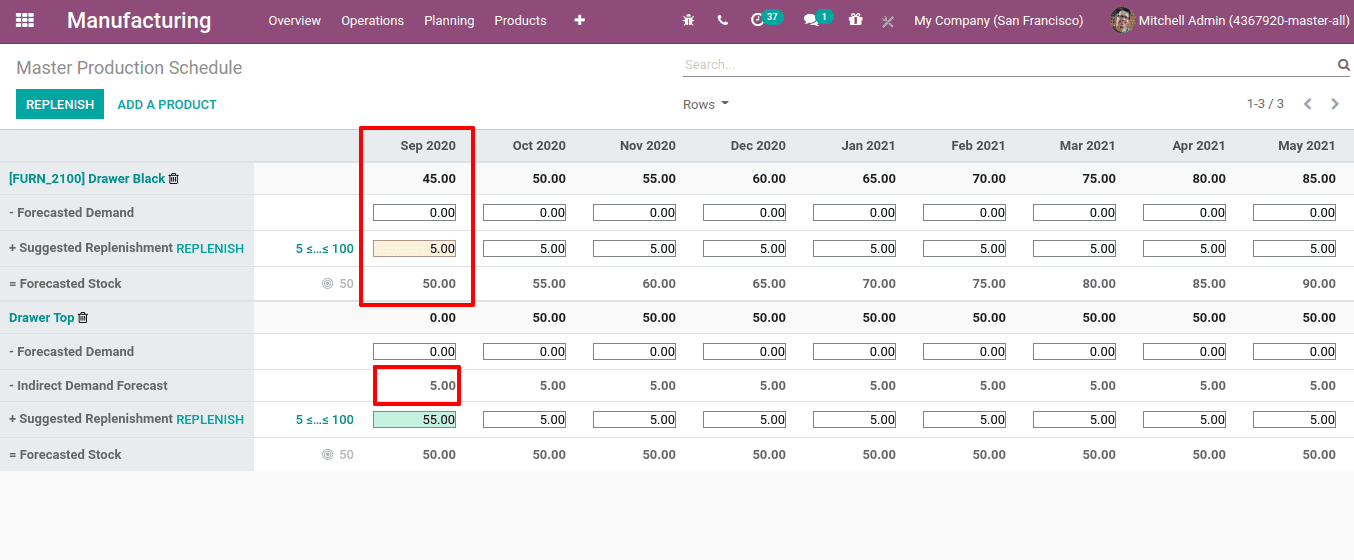
Here as the demand for drawer black increases the demand for drawer top also increases.
Cell color significance
As the product is under gone sale, the MPS shows cells in different colors.
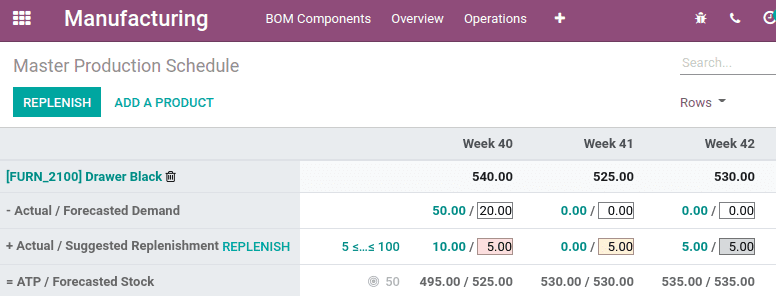
Gray: The order for replenishing has already been produced, and its quantity still matches actual quantity, that is actual replenishment and suggested replenishment are the same.
Green: Quantity of goods to be replenished in order to meet the expected safety stock, taking into account the forecasted demand and the indirect demand forecast.
RED: The order for replenishment has already been produced, and its quantity of current data was too high.
Orange: The order for replenishment has already been produced, and its quantity of current data was too low.


